| データ | 数値 |
|---|---|
| 個数 | |
| 平均 | |
| 分散 | |
| 標準偏差σ | |
| 中央値 |
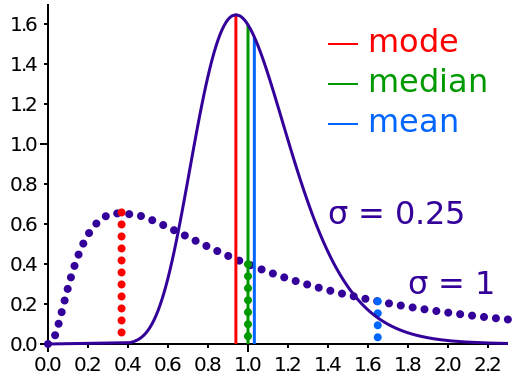
今後、対数正規分布への拡張を考え、標準正規分布シミュレーションに中央値・最頻値を追加します。
他、データ内容を有効数字0.0001でまとめて、表にまとめます。
まず有効数字を確定する必要なオブジェクトに以下メソッドを加えます
.toFixed(4)

// データの平均を求める
      const average = sum / nd.length;
      document.getElementById("average").textContent = average.toFixed(4);//有効数字0.0001まで
次に中央値を求めて表示します
<p>中央値:<span id="median"></span></p>

// データの中央値を求める
      const sortedData = [...nd].sort((a, b) => a - b);
      const middle = Math.floor(sortedData.length / 2);
      const median = sortedData.length % 2 === 0
        ? (sortedData[middle - 1] + sortedData[middle]) / 2
        : sortedData[middle];
      document.getElementById("median").textContent = median.toFixed(4);


// 1. [...nd] はデータのコピーを作成し、元のデータを変更せずにソートするためです。
//    ソート済みのデータが必要なのは、中央値を計算するためです。
// 2. .sort((a, b) => a - b) はデータを昇順にソートします。
//    a - b が負の値ならば、aはbよりも小さいとみなされます。
//    負でない場合は、aはbよりも大きいとみなされます。
// 3. Math.floor(sortedData.length / 2) はソートされたデータの長さを2で割り、
//    小数点以下を切り捨てて中央の位置を取得します。
//    これが中央値のインデックスです。
// 4. sortedData.length % 2 === 0 はデータの個数が偶数かどうかを判定します。
//    偶数の場合、中央値は中央の2つの値の平均です。
//    奇数の場合、中央値は中央の値そのものです。
// 5. 中央値の計算部分:
//    a. sortedData.length % 2 === 0 の場合、
//       (sortedData[middle - 1] + sortedData[middle]) / 2 で中央値を計算します。
//    b. そうでない場合、sortedData[middle] が中央値です。
// 6. 最終的に、計算された中央値が四捨五入して、四桁まで表示されるように
//    document.getElementById("median").textContent = median.toFixed(4); で設定します。
最頻値を求める予定でしたが、コードが複雑かつ冗長になりそうなので一旦保留し、グラフを目視することで確認とします。
続いて、表にまとめます。
全体のコードは以下の通り、長くなってしまいました。
<!DOCTYPE html>
<html>
  <head>
    <!-- Load plotly.js into the DOM -->
    <script src="https://cdn.plot.ly/plotly-2.27.0.min.js"></script>
  </head>
  <body>
    <div id="myDiv"><!-- Plotly chart will be drawn inside this DIV --></div>

    <!-- 新しい表を描画するための要素 -->
    <div class="tables-container">
      <div>
        <table class="table-container" border="1">
          <tr>
            <th>データ</th>
            <th>数値</th>
          </tr>
          <tr>
            <td>個数</td>
            <td><span id="pieces"></span></td>
          </tr>
          <tr>
            <td>平均</td>
            <td><span id="average"></span></td>
          </tr>
          <tr>
            <td>分散</td>
            <td><span id="variance"></span></td>
          </tr>
          <tr>
            <td>標準偏差σ</td>
            <td><span id="sd"></span></td>
          </tr>
          <tr>
            <td>中央値</td>
            <td><span id="median"></span></td>
          </tr>
        </table>
      </div>

      <!-- 既存の表を描画するための要素 -->
      <div id="tableDiv" class="table-container"></div>
    </div>

    <script>
      const nd = [];
      var nd1 = [];
      var nd2 = [];
      var nd3 = [];
      var nd4 = [];
      var nd5 = [];
      var nd6 = [];
      var nd7 = [];
      var nd8 = [];

      function getRandomValue() {
        var x, y, z;
        for (let i = 0; i < 100000; i++) {
          x = Math.random();
          y = Math.random();
          z = Math.sqrt(-2 * Math.log(x)) * Math.cos(2 * Math.PI * y);
          nd.push(z);
        }
      }

      // getRandomValue()を呼び出して100,000回発生させる
      getRandomValue();

      // データの個数を表示
      document.getElementById("pieces").textContent = nd.length;

      // データの合計を求める
      const sum = nd.reduce((a, b) => a + b, 0);

      // データの平均を求める
      const average = sum / nd.length;
      document.getElementById("average").textContent = average.toFixed(4);

      // データの分散を求める
      const sumSquaredDiff = nd.reduce((a, b) => a + (b - average) ** 2, 0);
      const variance = sumSquaredDiff / nd.length;
      document.getElementById("variance").textContent = variance.toFixed(4);

      // データの標準偏差を求める
      const standardDeviation = Math.sqrt(variance);
      document.getElementById("sd").textContent = standardDeviation.toFixed(4);

      // データの中央値を求める
      const sortedData = [...nd].sort((a, b) => a - b);
      const middle = Math.floor(sortedData.length / 2);
      const median = sortedData.length % 2 === 0 ? (sortedData[middle - 1] + sortedData[middle]) / 2 : sortedData[middle];
      document.getElementById("median").textContent = median.toFixed(4);

      // ヒストグラムの各バーに対する色を決定する関数
      function getColor(value) {
        const deviation = (value - average) / standardDeviation;
        if (deviation <= -3) {
          return "purple"; // -3標準偏差超
        } else if (deviation < -2) {
          return "orange"; // -3標準偏差以内
        } else if (deviation < -1) {
          return "cyan"; // -2標準偏差以内
        } else if (deviation < 0) {
          return "brown"; // -1標準偏差以内
        } else if (deviation < 1) {
          return "red"; // 1標準偏差以内
        } else if (deviation < 2) {
          return "green"; // 2標準偏差以内
        } else if (deviation < 3) {
          return "blue"; // 3標準偏差以内
        } else {
          return "yellow"; // 3標準偏差超
        }
      }

      // データを各範囲に分ける
      nd.forEach((value) => {
        const color = getColor(value);
        if (color === "purple") {
          nd1.push(value);
        } else if (color === "orange") {
          nd2.push(value);
        } else if (color === "cyan") {
          nd3.push(value);
        } else if (color === "brown") {
          nd4.push(value);
        } else if (color === "red") {
          nd5.push(value);
        } else if (color === "green") {
          nd6.push(value);
        } else if (color === "blue") {
          nd7.push(value);
        } else {
          nd8.push(value);
        }
      });

      var trace1 = {
        x: nd1,
        type: "histogram",
        marker: {
          color: "purple",
        },
        xbins: {
          end: 5,
          size: 0.1,
          start: -5,
        },
        bingroup: "group1", // 各トレースを同じグループに追加
      };

      var trace2 = {
        x: nd2,
        type: "histogram",
        marker: {
          color: "orange",
        },
        xbins: {
          end: 5,
          size: 0.1,
          start: -5,
        },
        bingroup: "group2", // 各トレースを同じグループに追加
      };

      var trace3 = {
        x: nd3,
        type: "histogram",
        marker: {
          color: "cyan",
        },
        xbins: {
          end: 5,
          size: 0.1,
          start: -5,
        },
        bingroup: "group3", // 各トレースを同じグループに追加
      };
      var trace4 = {
        x: nd4,
        type: "histogram",
        marker: {
          color: "brown",
        },
        xbins: {
          end: 5,
          size: 0.1,
          start: -5,
        },
        bingroup: "group4", // 各トレースを同じグループに追加
      };
      var trace5 = {
        x: nd5,
        type: "histogram",
        marker: {
          color: "red",
        },
        xbins: {
          end: 5,
          size: 0.1,
          start: -5,
        },
        bingroup: "group5", // 各トレースを同じグループに追加
      };
      var trace6 = {
        x: nd6,
        type: "histogram",
        marker: {
          color: "green",
        },
        xbins: {
          end: 5,
          size: 0.1,
          start: -5,
        },
        bingroup: "group6", // 各トレースを同じグループに追加
      };
      var trace7 = {
        x: nd7,
        type: "histogram",
        marker: {
          color: "blue",
        },
        xbins: {
          end: 5,
          size: 0.1,
          start: -5,
        },
        bingroup: "group7", // 各トレースを同じグループに追加
      };
      var trace8 = {
        x: nd8,
        type: "histogram",
        marker: {
          color: "yellow",
        },
        xbins: {
          end: 5,
          size: 0.1,
          start: -5,
        },
        bingroup: "group8", // 各トレースを同じグループに追加
      };

      var data = [trace1, trace2, trace3, trace4, trace5, trace6, trace7, trace8];

      var layout = {
        bargap: 0.01,
        bargroupgap: 0.01,
        title: "Sampled Results",
        xaxis: { title: "Value" },
        yaxis: { title: "Count" },
      };

      Plotly.newPlot("myDiv", data, layout);
      // 表を描画するためのデータ
      var tableData = [
        ["標準偏差", "範囲", "個数", "確率", "累積分布"],
        ["-3σ ~", -3 * standardDeviation.toFixed(1) + "~", nd1.length, (nd1.length / nd.length).toFixed(4), (nd1.length / nd.length).toFixed(4)],
        [
          "-2σ ~ -3σ",
          -2 * standardDeviation.toFixed(1) + "~" + -3 * standardDeviation.toFixed(1),
          nd2.length,
          (nd2.length / nd.length).toFixed(4),
          ((nd1.length + nd2.length) / nd.length).toFixed(4),
        ],
        [
          "-1σ ~ -2σ",
          -1 * standardDeviation.toFixed(1) + "~" + -2 * standardDeviation.toFixed(1),
          nd3.length,
          (nd3.length / nd.length).toFixed(4),
          ((nd1.length + nd2.length + nd3.length) / nd.length).toFixed(4),
        ],
        [
          "平均 ~ -1σ",
          average.toFixed(1) + "~" + -1 * standardDeviation.toFixed(1),
          nd4.length,
          (nd4.length / nd.length).toFixed(4),
          ((nd1.length + nd2.length + nd3.length + nd4.length) / nd.length).toFixed(4),
        ],
        [
          "1σ ~ 平均",
          standardDeviation.toFixed(1) + "~" + average.toFixed(1),
          nd5.length,
          (nd5.length / nd.length).toFixed(4),
          ((nd1.length + nd2.length + nd3.length + nd4.length + nd5.length) / nd.length).toFixed(4),
        ],
        [
          "2σ ~ 1σ",
          2 * standardDeviation.toFixed(1) + "~" + standardDeviation.toFixed(1),
          nd6.length,
          (nd6.length / nd.length).toFixed(4),
          ((nd1.length + nd2.length + nd3.length + nd4.length + nd5.length + nd6.length) / nd.length).toFixed(4),
        ],
        [
          "3σ ~ 2σ",
          3 * standardDeviation.toFixed(1) + "~" + 2 * standardDeviation.toFixed(1),
          nd7.length,
          (nd7.length / nd.length).toFixed(4),
          ((nd1.length + nd2.length + nd3.length + nd4.length + nd5.length + nd6.length + nd7.length) / nd.length).toFixed(4),
        ],
        [
          " ~ 3σ",
          "~" + 3 * standardDeviation.toFixed(1),
          nd8.length,
          (nd8.length / nd.length).toFixed(4),
          ((nd1.length + nd2.length + nd3.length + nd4.length + nd5.length + nd6.length + nd7.length + nd8.length) / nd.length).toFixed(4),
        ],
      ];

      // 表を描画
      var tableDiv = document.getElementById("tableDiv");
      var table = document.createElement("table");
      var thead = document.createElement("thead");
      var tbody = document.createElement("tbody");

      table.appendChild(thead);
      table.appendChild(tbody);
      tableDiv.appendChild(table);

      // theadを追加
      var headRow = thead.insertRow();
      tableData[0].forEach(function (item) {
        var th = document.createElement("th");
        th.appendChild(document.createTextNode(item));
        // セルのスタイルを追加
        th.style.border = "1px solid #000";
        th.style.padding = "10px";
        th.style.backgroundColor = "#f0f0f0";
        headRow.appendChild(th);
      });

      // tbodyを追加
      tableData.slice(1).forEach(function (row) {
        var tr = document.createElement("tr");
        row.forEach(function (item) {
          var td = document.createElement("td");
          td.appendChild(document.createTextNode(item));
          // セルのスタイルを追加
          td.style.border = "1px solid #000";
          td.style.padding = "10px";
          td.style.backgroundColor = "#ffffff"; // 他のセルの背景色
          tr.appendChild(td);
        });
        tbody.appendChild(tr);
      });

      // 1列目のセルに色を付ける
      var targetCell = document.querySelector("#tableDiv tbody tr:nth-child(1) td:first-child");
      targetCell.style.backgroundColor = "purple";
      targetCell.style.color = "white";

      var targetCell = document.querySelector("#tableDiv tbody tr:nth-child(2) td:first-child");
      targetCell.style.backgroundColor = "orange";
      targetCell.style.color = "white";

      var targetCell = document.querySelector("#tableDiv tbody tr:nth-child(3) td:first-child");
      targetCell.style.backgroundColor = "cyan";
      targetCell.style.color = "white";

      var targetCell = document.querySelector("#tableDiv tbody tr:nth-child(4) td:first-child");
      targetCell.style.backgroundColor = "brown";
      targetCell.style.color = "white";

      var targetCell = document.querySelector("#tableDiv tbody tr:nth-child(5) td:first-child");
      targetCell.style.backgroundColor = "red";
      targetCell.style.color = "white";

      var targetCell = document.querySelector("#tableDiv tbody tr:nth-child(6) td:first-child");
      targetCell.style.backgroundColor = "green";
      targetCell.style.color = "white";

      var targetCell = document.querySelector("#tableDiv tbody tr:nth-child(7) td:first-child");
      targetCell.style.backgroundColor = "blue";
      targetCell.style.color = "white";

      var targetCell = document.querySelector("#tableDiv tbody tr:nth-child(8) td:first-child");
      targetCell.style.backgroundColor = "yellow";
      targetCell.style.color = "white";
    </script>
  </body>
</html>

中央値 - Wikipedia
ja.wikipedia.org

最頻値 - Wikipedia
ja.wikipedia.org

コメント